DON'T CHASE THE MARKET. If you are slow, and miss a day trade that suddenly looks like it would have made you a fortune, do NOT panic and try to jump in late - you will almost certainly be buying the top or selling the bottom. Remember that the market will be there tomorrow, and the day after, and for ever, so ANY trade, no matter how important it looks, can be ignored if necessary. Keeping your powder dry, and being ready for the next one, is more important than hitting every day trading opportunity you see. Many successful day traders only trade for a few hours a day - they miss plenty of action but don't care, because they know the market will be around when they come back.
LAST CLOSE @ 5730
THE SHORT TERM TECHNICAL PICTURE IS STILL BULLISH.
FOLLOW BUY ON DIPS STRATEGY
A BREAKDOWN BELOW 5630 WILL SIGNAL THAT THE UPTREND IS FINISHED AND ALSO A MOVE ABOVE 5770 SIGNAL CONTINUATION OF UPMOVE
MAIN SUPPORT AROUND @ 5640---------- 5630 LEVELS
MAIN RESISTANCE AROUND @ 5780--------- 5790 LEVELS
IF PRICE CAN TRADE AND SUSTAIN ABOVE 5735 WITH VOLUME FOR 10- 20 MINUTES
THEN BULLS TRY TO KISS
5766 ------ 5780 ------- 5785- -----5790
TRADE BELOW 5730
SEE NON STOP FALL UPTO
5708 -------- 5700
THEREAFTER
5678 AND 5670 WILL ACT AS SUPPORT


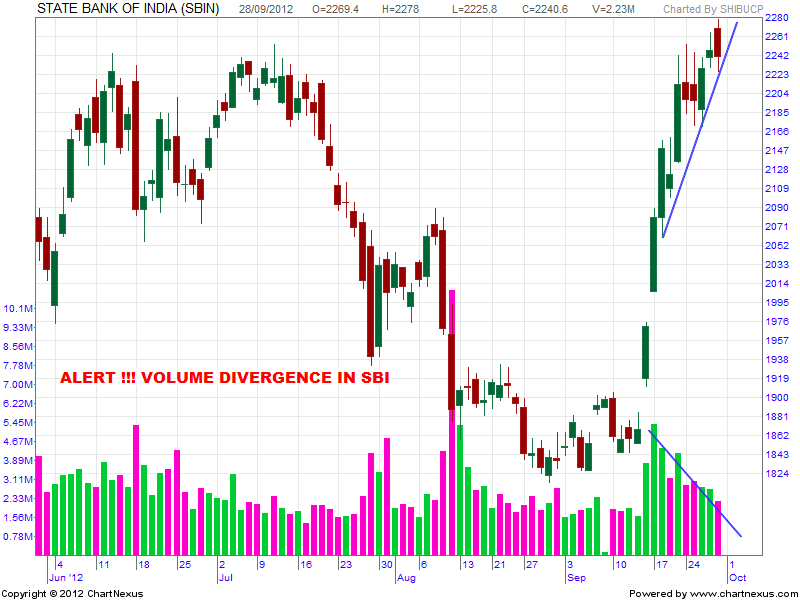
LAST CLOSE @ 2241
MAIN SUPPORT @ 2170- 2155
MAIN RESISTANCE @ 2285- 2300
INTRADAY VIEW
TRADING BELOW 2240...INDICATING WEAKNESS
SEE SLIDE UPTO 2225 - 2215
INTRADAY RESISTANCE @
2252 ------- 2265- -------2278
.jpg)

LAST CLOSE @ 1059
MAIN SUPPORT @ 1050 AND 1030
MAIN RESISTANCE @ 1085 AND 1090
INTRADAY VIEW
SUPPORT @ 1050 AND 1041
INTRADAY RESISTANCE
@
1072 AND 1080
.jpg)

LAST CLOSE @ 431.50
SUPPORT @ 420- ---------423 LEVELS
STIFF RESISTANCE AROUND 445


LAST CLOSE @ 1136
INTRADAY SUPPORT @ 1130 - 1120
STRONG SUPPORT @ 1120
RESISTANCE AROUND 1150 AND 1160
Subject To Disclaimer
.jpg)


.jpg)